
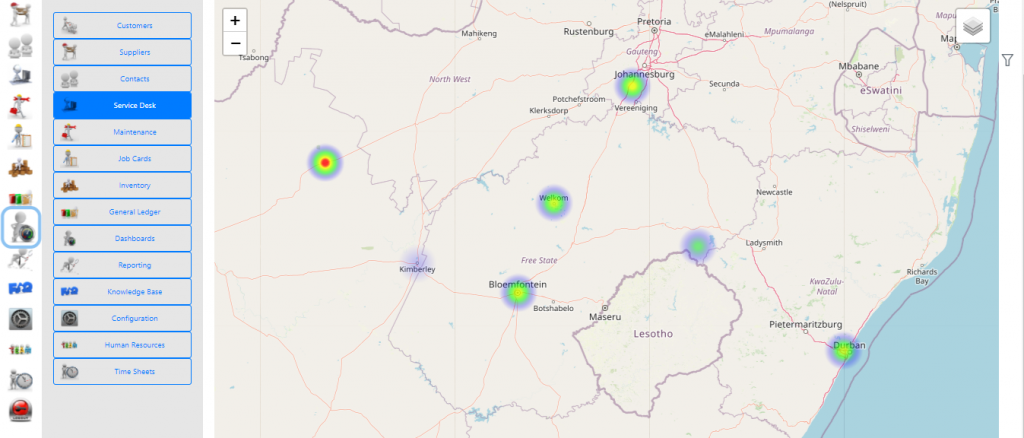
The Service Desk Heat Map dashboard is based on the longitude and latitude being set for the customer under whom the call has been raised.
This can be found under Dashboards > Service Desk > Heat-Map
The map shows as a heat map highlighting areas where the service desk cases where raised.
From the filter you can select what data to show as well as what to prioritise on the map from the below list.
- Logged – This retrieves all cases logged in the date range that comply with the corresponding filters.
- Priority – This retrieves all cases logged in the date range that comply with the corresponding filters multiplied by the PriorityID of each case. This will usually apply a greater weighting on a Critical case vs a lesser weighting on a Normal case.
- Time to Resolve – This is calculated on a per case bases then averaged out over all cases. This can be very effective when looking at a single filter like Priority.
- Open – This retrieves all Open cases logged in the date range that comply with the corresponding filters.
- Closed – This retrieves all Closed cases logged in the date range that comply with the corresponding filters.