
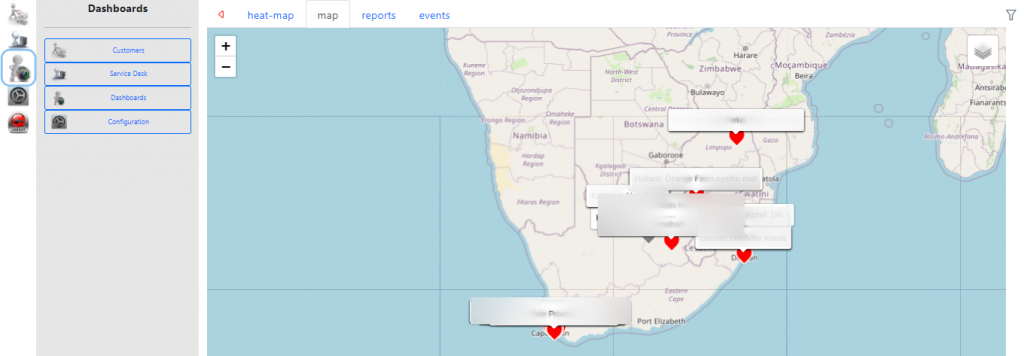
The Service Desk Map dashboard is based on the longitude and latitude being set for the customer under whom the call has been raised.
This can be found under Dashboards > Service Desk > Map
The map shows as a pin map highlighting areas where the service desk cases where raised with highest priority.
From the filter ![]() you can select what data to show from the below list.
you can select what data to show from the below list.
- Logged – This retrieves all cases logged in the date range that comply with the corresponding filters.
- Priority – This retrieves all cases logged in the date range that comply with the corresponding filters multiplied by the PriorityID of each case this will usually apply a greater weighting on a Critical case vs a lesser weighting on a Normal case.
- Time to Resolve – This is calculated on a per case bases then averaged out over all cases. This can be very effective when looking at a single filter like Priority.
- Open – This retrieves all Open cases logged in the date range that comply with the corresponding filters.
- Closed – This retrieves all Closed cases where the logged date is in the date range that comply with the corresponding filters