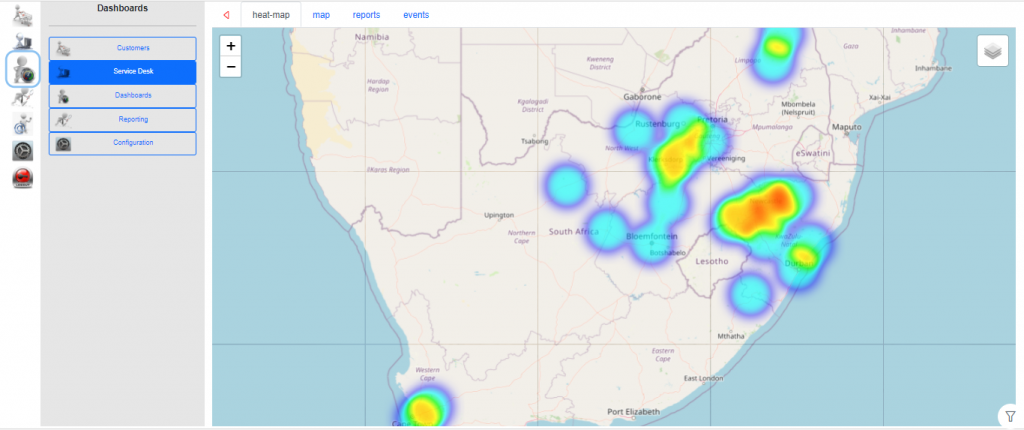
The Service Desk dashboard is based on sites containing Service Desk case.
This can be found under Dashboards > Service Desk
By selecting the filter ![]() on the bottom right you can access the filter options.
on the bottom right you can access the filter options.
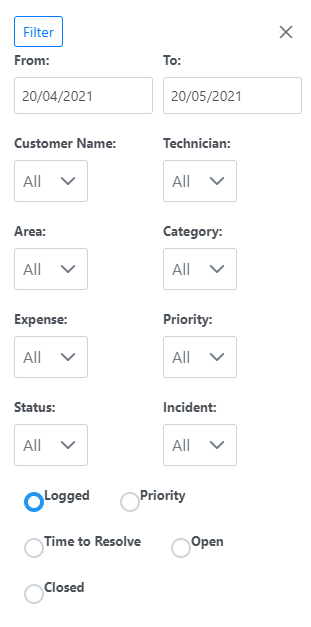
The filters enable you to choose the dataset to work with in the Service Desk Dashboards.
Defaults:
sets From date to one month back.
sets To date to one month advanced.
sets Status to Current (All Statuses with a StatusID below 90).
sets Report to run as Logged.
- Customer Name:- Can be selected as a single or multi selectable item with a filter to search.
- Technician:- Can be selected as a single or multi selectable item with a filter to search.
- Area:- Can be selected as a single or multi selectable item with a filter to search.
- Category:- Can be selected as a single or multi selectable item with a filter to search.
- Expense Type:- Can be selected as a single or multi selectable item with a filter to search.
- Priority:- Can be selected as a single or multi selectable item with a filter to search.
- Status:- Can be selected as a single or multi selectable item with a filter to search.
- Incident Type:- Can be selected as a single or multi selectable item with a filter to search.
- Report to run:
- Logged – This retrieves all cases logged in the date range that comply with the corresponding filters.
- Priority – This retrieves all cases logged in the date range that comply with the corresponding filters multiplied by the PriorityID of each case this will usually apply a greater weighting on a Critical case vs a lesser weighting on a Normal case represented in the heat-map.
- Time to Resolve – This is calculated on a per case bases then averaged out over all cases. This can be very effective when filtering on additional data like Priority.
- Open – This retrieves all currently Open cases logged in the date range that comply with the corresponding filters.
- Closed – This retrieves all Closed cases logged in the date range that comply with the corresponding filters
There are multiple tabs that can be selected and represent data filtered the same way.
There is the Heat-Map that shows as a heat map highlighting areas where the service desk cases where raised.
There is the Map that shows as a map highlighting Sites where the service desk cases where raised coloured by Priority.
There is the Reports that shows a list of sites where the service desk cases where raised, this is a great way to extract data for further analysis and manipulation.
There is the Events that shows a breakdown of sites with number of calls logged over the timeline for which you have filtered on.